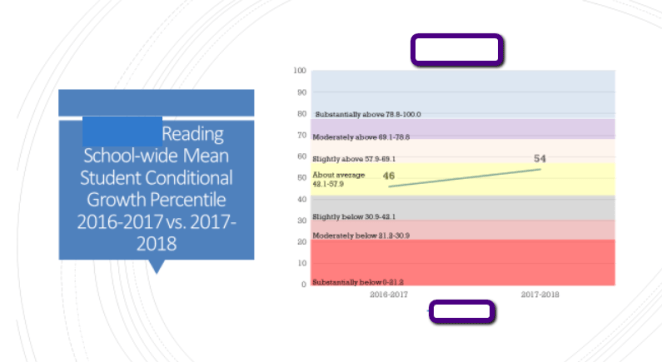
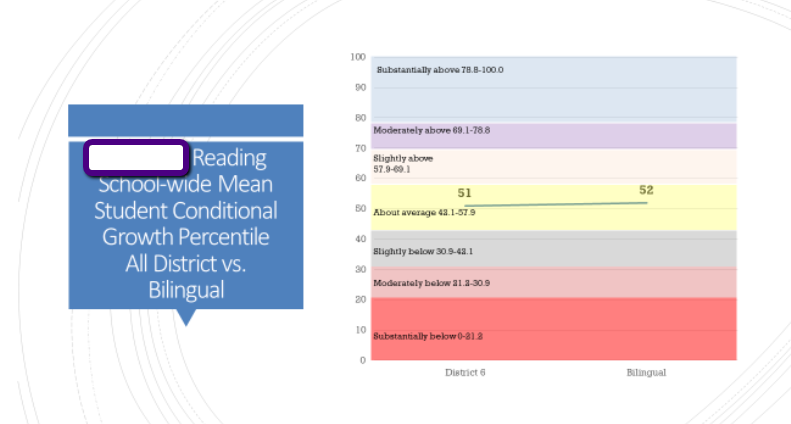
These slide images are taken from a presentation that I created for the Board of Education in spring 2018. Executive leadership shared the data and information in this presentation with school leaders, who shared the data with school staff.
I decided to include growth data–here represented by mean conditional growth index–in response to a report on the Illinois State Board of Education’s Technical Advisory Council’s April recommendation that Illinois include shifts in student growth indices as part of the new school report card. Including MAP conditional growth index scores was first step in the ongoing capacity-building I continue to facilitate with district staff regarding how testing outcomes relate to school accountability.